
I see the same problem on our battery test bench: people expect “10 years” automatically, then they run high current in hot enclosures and wonder why runtime drops.
LiFePO4 batteries commonly deliver about 8–15 years of dependable service, and many are rated for roughly 3,000–6,000 cycles to around 80% capacity when used correctly. Real lifespan depends on depth of discharge, temperature, charge/discharge current, storage habits, and BMS protection, so gentle daily cycling can last far longer than harsh peak-shaving abuse.
So, let’s translate “years vs cycles” into real solar usage, and give you field rules that protect lifespan.
What Is a LiFePO4 (Lithium Iron Phosphate) Battery?
On our production line, we treat LiFePO4 packs differently from “generic lithium” because the chemistry is stable, but it still hates heat and abuse.
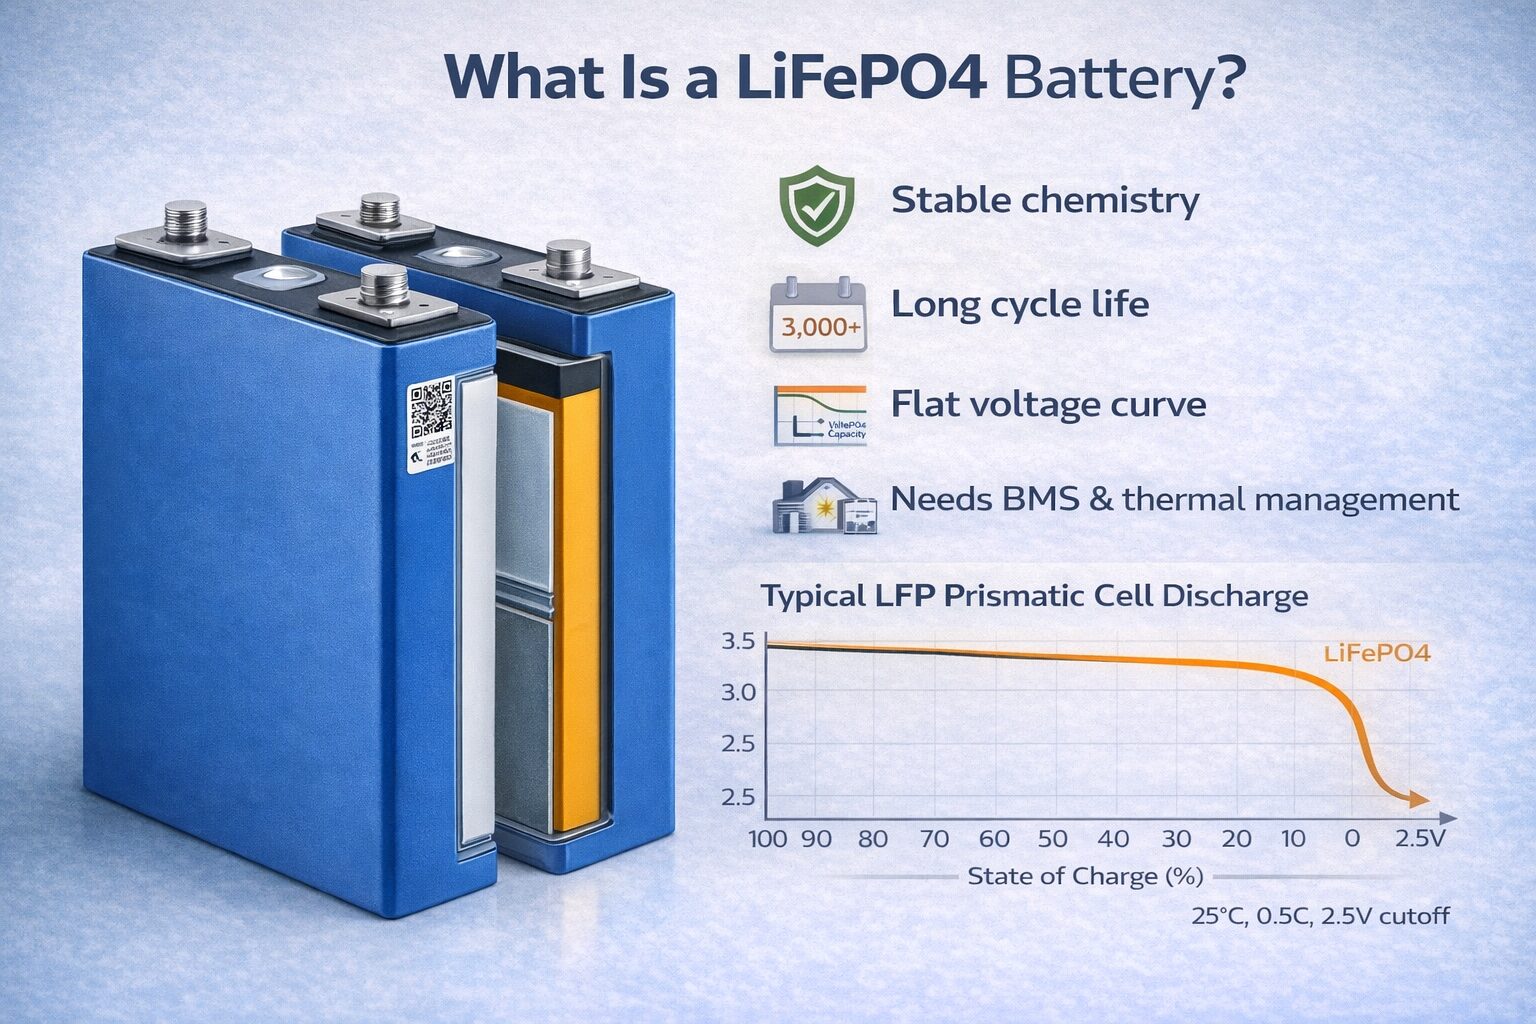
A LiFePO4 (LFP) battery is a lithium-ion battery that uses lithium iron phosphate as the cathode material. It is known for strong thermal stability, long cycle life, and a relatively flat discharge voltage curve. In solar storage, LFP is popular because it can deliver many cycles with consistent performance when protected by a proper BMS and charging profile.
What makes LFP different in real solar systems
LFP is still “lithium-ion,” but it behaves differently than common NMC/NCA chemistries used in many EVs and consumer electronics.
- Safety and stability: LFP is widely regarded as more thermally stable than many other lithium chemistries. That does not mean “no risk.” It means you still design for fusing, isolation, and ventilation, but you get more margin.
- Long cycle life: Many mainstream LFP products are marketed around “thousands of cycles” to a defined capacity threshold, often around 80% state of health (SoH). In the field, that’s why LFP dominates residential and C&I solar storage discussions.
- Voltage behavior: LFP has a flat-ish voltage curve through much of its usable range. That is good for inverters, but it also means voltage is a weak fuel gauge in the mid-range. SoC estimation often needs coulomb counting plus periodic calibration.
- BMS dependence: LFP packs rely heavily on a Système de gestion de batterie (BMS) to prevent overcharge, over-discharge, and temperature abuse. When we troubleshoot early failures, weak BMS logic or poor sensor placement is a common culprit.
Two kinds of “life”: calendar vs cycle
People argue about “how many years” because they mix two mechanisms:
- Calendar life: aging that happens with time, even if you barely cycle.
- Cycle life: aging from charge/discharge throughput, especially deep cycling and high current.
In solar, you often get both at once. That is why “years” and “cycles” must be translated into your actual duty cycle.
Helpful references (non-exhaustive): EcoFlow blog on LFP lifespan framing (years vs maintenance), Anern on DoD and cycle expectations, Renogy on temperature guidance, LithiumHub’s overview article, Battery University on longevity habits.
Sources: EcoFlow (https://www.ecoflow.com/uk/blog/lifepo4-battery-life), Renogy (https://www.renogy.com/blogs/general-solar/how-long-do-lifepo4-batteries-last), LithiumHub (https://lithiumhub.com/lifepo4-battery-life-how-long-do-they-really-last/), Battery University (https://www.batteryuniversity.com/article/bu-808-how-to-prolong-lithium-based-batteries/)
How Long Do LiFePO4 Batteries Last (Years vs. Charge Cycles)?
In our QC cycle tests, I can make the same pack “last 10 years” or “feel old in 3 years” just by changing current, temperature, and how deep we swing it.
Most quality LiFePO4 packs deliver roughly 8–15 years of dependable service, and many are rated around 3,000–6,000 cycles to about 80% capacity under moderate conditions. Years describe calendar aging, while cycles describe throughput aging. Your real lifespan is best predicted by Equivalent Full Cycles (EFCs), plus how hot and how hard the pack works day to day.
Years vs cycles: how to translate ratings into your use
Most marketing gives you a cycle number (or a year number). The honest answer is: you need both.
- Cycle rating is usually defined to a capacity threshold, commonly ~80% of original capacity (SoH). That is a benchmark, not a cliff.
- Years depends on storage SoC, average temperature, and how often you sit at high SoC.
Equivalent Full Cycles (EFC): the simplest “truth meter”
A “cycle” is not “one time you plug in.” In real solar use, partial cycles add up.
- Two 50% swings ≈ 1 EFC
- Four 25% swings ≈ 1 EFC
This is why people who “only use a little every day” can still accumulate meaningful cycle count over time. A practical way to log life is EFCs from your inverter/EMS data.
Your note — 6000 cycles ≈ 10 years has conditions
Your insight is exactly how we model it internally:
- If an LFP pack can deliver ~6000 cycles, and you do ~1 EFC per day, that’s ~6000 days.
- 6000 ÷ 365 = 16.44 years (math on ideal cycles alone).
- In the real world, calendar aging and non-ideal conditions reduce that, so “10+ years is realistic” under gentle operation is a fair, practical statement.
But your “premises” matter a lot:
- ~0.2C discharge (low stress, low heat).
- ~25°C operating temperature (sweet spot).
- Avoiding extreme temperature and high C-rate spikes.
A practical “life translation” table (use as planning, not a guarantee)
Below are example translations that help installers and EPCs set expectations. These are not universal promises. They are decision aids.
| Use Pattern (Example) | Avg DoD Band | Approx EFC/day | Thermal/C-rate Stress | What You Typically See |
|---|---|---|---|---|
| Gentle self-consumption | 25–75% most days | 0.3–0.7 | Low (cool, <0.3C typical) | Long service life, slow fade |
| Daily full swing | 10–90% or 0–100% | 0.8–1.0 | Moderate if cool | Good life if kept cool |
| Peak shaving with high power | Wide swings + high kW peaks | 0.7–1.2 | High (heat + current) | Faster wear, earlier resistance rise |
| Backup-only standby | Rare cycling | ~0.0–0.1 | Mostly calendar aging | Years depend on storage SoC + heat |
The “80% end-of-life” truth most buyers miss
End-of-life at 80% SoH does not mean the battery is useless.
- If your application has margin, you may keep using it for years.
- The pack becomes “smaller.” It is not instantly “dead.”
- The right question becomes: “Does it still meet my runtime and power needs with acceptable voltage sag?”
What Affects LiFePO4 Battery Life? (DoD, Temperature, Charging, Storage)
When we do failure analysis, the root cause is rarely “bad chemistry.” It is usually heat, high current, or poor charge control that quietly accelerates aging.
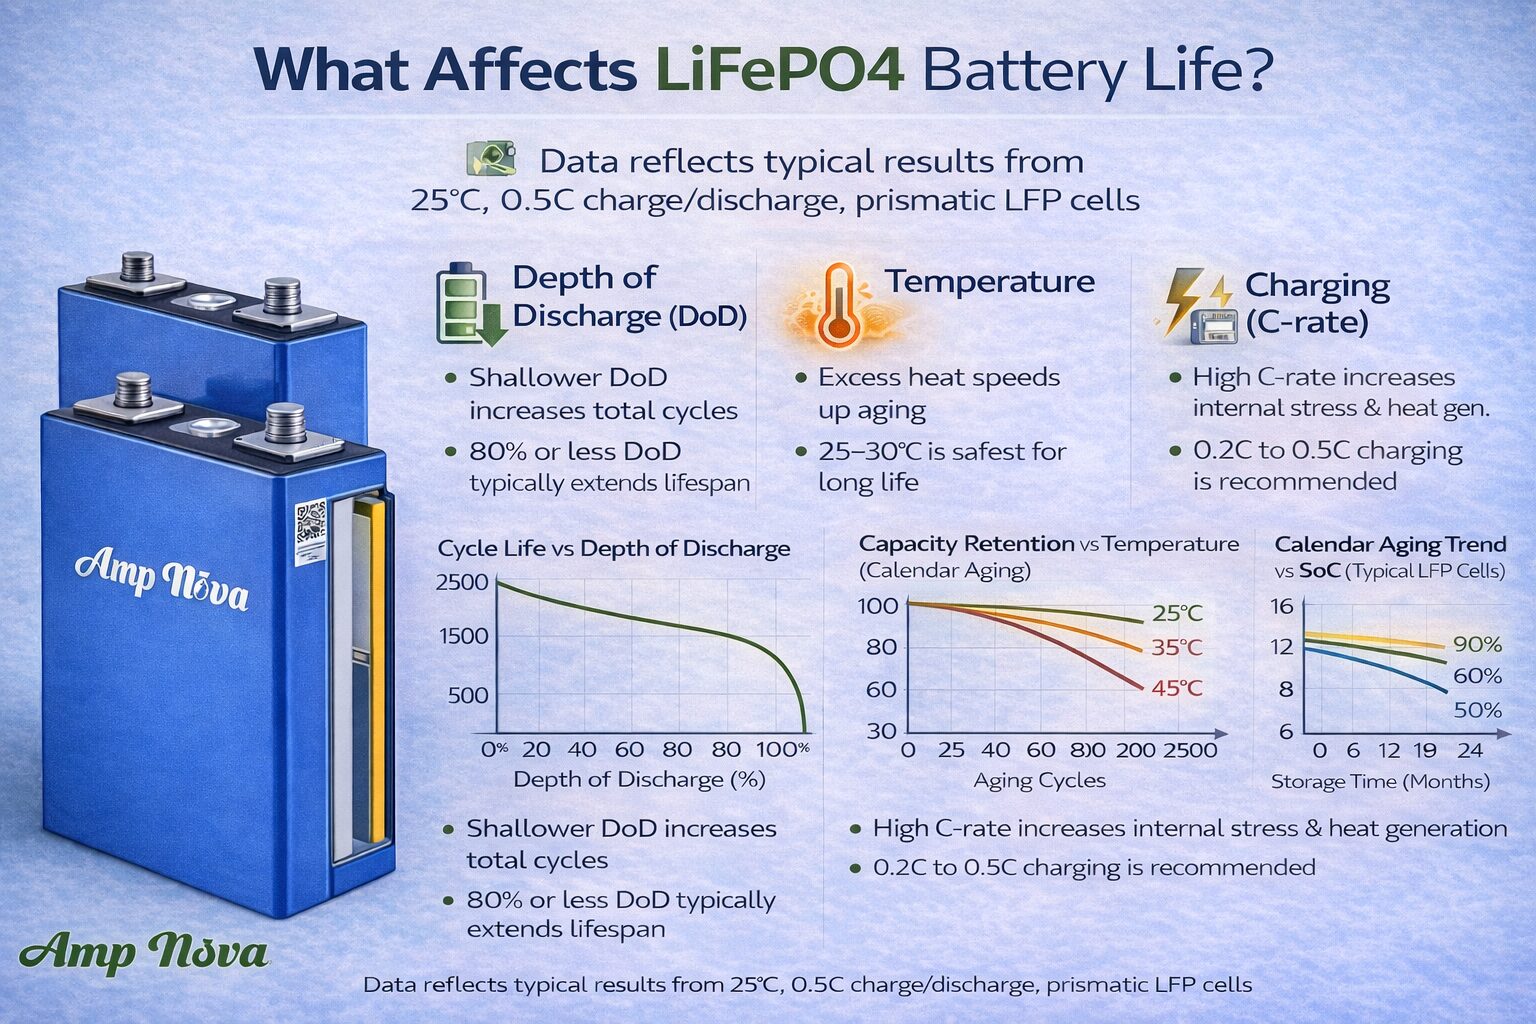
LiFePO4 lifespan is most affected by depth of discharge (DoD), temperature exposure, charge/discharge current (C-rate), and how the battery is charged and stored. Shallower cycling typically yields more total cycles, heat accelerates both calendar and cycle aging, and high C-rate spikes increase stress and internal heating. Proper charge limits, storage SoC, and a reliable BMS reduce damage from over-voltage, under-voltage, and temperature abuse.

1) Depth of Discharge (DoD): the biggest cycle-life lever
DoD is “how much you take out” each cycle.
- Deep cycling (near 100% DoD) is convenient, but it costs cycles.
- Shallower cycling (like 50% DoD) usually yields materially more cycles over life.
Decision rule we use in system sizing:
If the customer wants maximum life and has enough capacity, design daily operation to live in a mid-SoC band and reserve deep cycles for rare events.
2) Temperature: the biggest calendar-life lever (and a silent killer)
Temperature drives side reactions and also raises internal resistance losses.
- High heat for long periods is damaging even if cycling is light.
- Charging in cold conditions can be risky for lithium chemistries if the BMS does not block it.
Field reality: “It works in summer” is not the same as “it will last in summer.” Put the pack where it stays cool. Avoid sealing it in hot garages without airflow.
3) C-rate and current spikes: power is not free
Your note about 0.2C is a key point installers often ignore.
- A pack can be rated for high current, but that does not mean high current is “healthy.”
- High current increases heat and accelerates wear.
- Even short peaks matter if they repeat daily.
Quick C-rate refresher:
C-rate = current divided by capacity.
Example: 100Ah pack at 20A discharge = 0.2C.
4) Charging profile and BMS quality: where “paper specs” become real life
Most longevity guidance points to charging discipline and protection electronics.
- Correct voltage limits protect cells from overcharge stress.
- Low-voltage cutoffs prevent harmful deep discharge.
- Temperature sensors must be accurate and placed well.
- Balancing behavior matters for long-term pack uniformity.
5) Storage habits: don’t park it full forever
If a solar system frequently tops to 100% and then sits full for long hours, that can increase calendar aging.
A practical longevity approach many technicians use:
- Operate mid-SoC most days.
- Charge to 100% only occasionally to allow balancing (if the BMS balances at high SoC).
Factor impact table (installer-ready)
Use this table when you are troubleshooting why a “10-year” battery looks tired early.
| Factor | What It Changes | Typical Symptom | What To Do |
|---|---|---|---|
| High DoD daily | Faster cycle aging | Capacity fades sooner | Increase usable capacity or tighten SoC window |
| High average temperature | Faster calendar + cycle aging | Rising resistance, more voltage sag | Improve ventilation, move location, shade enclosure |
| High C-rate peaks | Heat + stress | Early BMS cutoffs under load | Reduce peak power, parallel strings, bigger inverter match |
| Always at 100% SoC | Calendar aging | Slow but steady capacity loss | Add “top-off schedule” instead of constant float |
| Poor BMS sensing/cutoffs | Safety + longevity risk | Random shutdowns, imbalance | Validate BMS specs, wiring, and sensor placement |
How to Extend LiFePO4 Battery Lifespan: Best Charging & Maintenance Practices
On our line, we can spot “future returns” by looking at how customers plan to charge and where they mount the pack. Most lifespan wins come from boring discipline.
To extend LiFePO4 lifespan, keep temperature moderate, avoid routine 0–100% cycling, reduce high C-rate peaks, and follow a LiFePO4-specific charging profile with a capable BMS. Operate in a mid-state-of-charge band most days, charge to 100% only occasionally for balancing if needed, and verify performance with periodic capacity checks and voltage-sag trends instead of relying on age alone.
Charging settings: practical targets (always confirm with your vendor datasheet)
I avoid “one-size-fits-all” voltages because pack design differs (cell count, BMS behavior, inverter settings). Still, the strategy is consistent.
Strategy first:
- Prefer daily mid-SoC operation over daily full.
- Use gentle current when possible (your 0.2C point is excellent).
- Avoid long hot soaks at high SoC.
A simple operating playbook (solar-friendly)
Daily (most days):
- Set an SoC window like 25–75% or 30–80% if your system supports it.
- Limit charge/discharge power so typical current is comfortably below continuous rating.
Weekly or monthly (maintenance):
- Charge to full occasionally if your BMS balances at high SoC.
- Let the pack rest briefly near top-of-charge if balancing needs time (only if the vendor recommends it).
Seasonal:
- In hot seasons, tighten power limits and improve ventilation.
- In cold seasons, ensure the BMS blocks charging below safe temperature.
Maintenance checks you can actually do
You do not need a lab. You need consistent logs.
- Runtime trend: Same load, same conditions, shorter runtime = capacity loss or rising resistance.
- Voltage sag trend: Under the same load, deeper sag over time often indicates resistance rise.
- BMS logs: Look for high-temperature events, high-current events, and low-voltage cutoffs.
Storage rules (for warehouses and spare packs)
If a pack will sit unused:
- Store at a moderate SoC (often around 40–60% as general guidance).
- Keep it cool and dry.
- Check SoC periodically and top up if it drifts too low.
Charging & care checklist table (field-ready)
| Goal | What To Set / Do | Why It Helps | Common Mistake |
|---|---|---|---|
| Reduce cycle wear | Use a mid-SoC band most days | Fewer deep swings | Daily 0–100% because “it’s there” |
| Reduce heat stress | Improve airflow, avoid hot enclosures | Heat accelerates aging | Mounting near inverters/chargers with no ventilation |
| Reduce current stress | Keep typical discharge near ~0.2–0.5C if feasible | Less heating and stress | Sizing the battery just to meet peak kW |
| Ensure balancing | Full charge occasionally (per BMS design) | Prevents drift and weak cells | Never reaching balance point, leading to early cutoffs |
| Prevent abuse | Use correct BMS + correct charge profile | Avoid over/under voltage and cold charging | Using lead-acid charger settings on LFP |
Helpful reading: Battery University’s longevity habits overview is a good mental model for “lower stress = longer life,” even though implementation details vary by pack.
Source: Battery University (https://www.batteryuniversity.com/article/bu-808-how-to-prolong-lithium-based-batteries/)
LiFePO4 vs Lead-Acid Batteries: Which Lasts Longer (and Why)?
In our incoming inspection of failed batteries, lead-acid usually dies from sulfation and deep discharge history, while LFP usually “ages out” more gracefully if the controls are right.
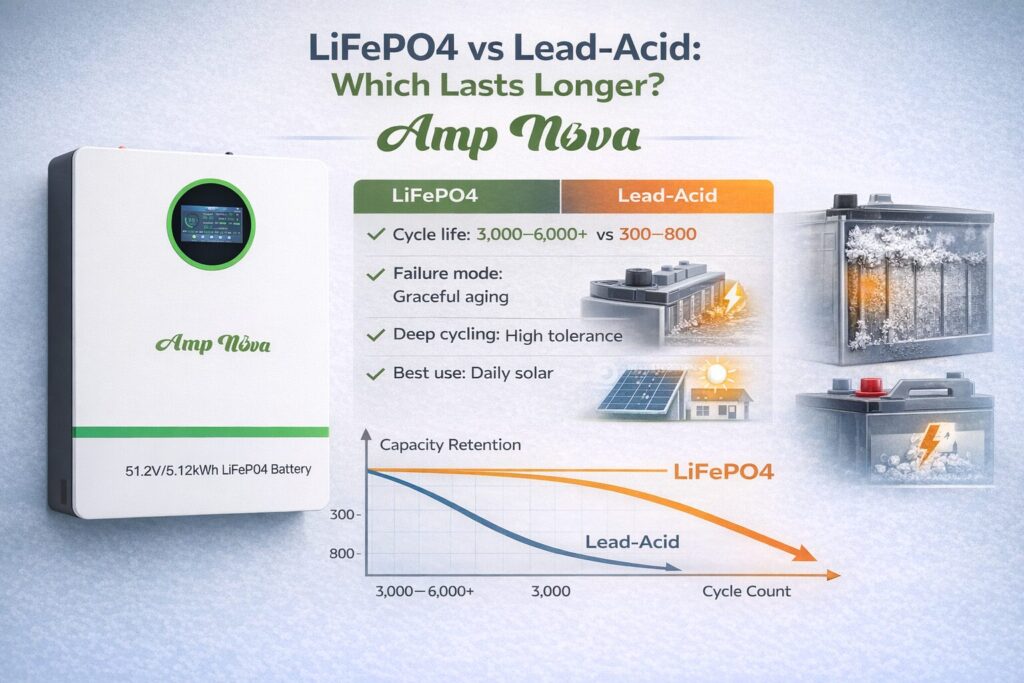
LiFePO4 batteries typically last longer than lead-acid because they tolerate far more cycles before meaningful capacity loss and they avoid common lead-acid failure modes like sulfation from partial state of charge. Lead-acid life drops sharply with deep cycling and poor recharge habits, while LFP can handle frequent cycling with less damage when protected by a BMS and charged correctly. The real advantage shows up in daily-cycling solar use and high uptime requirements.
Why lead-acid often underperforms in solar cycling
Lead-acid can be cost-effective, but it is sensitive to real-world behavior:
- Partial state of charge operation often causes sulfation.
- Deep discharge hurts more and recovers less.
- Recharge time and absorption behavior matter a lot.
If you see a site that “never fully recharges” (cloudy climates, undersized PV), lead-acid tends to suffer earlier.
Why LFP tends to win on lifecycle service
LFP advantages in typical solar duty:
- Strong cycle resilience when operated moderately.
- Less maintenance compared to flooded lead-acid.
- More stable performance across much of the discharge curve.
But LFP is not magic:
- A weak BMS can cause nuisance trips or imbalance.
- High C-rate + heat can erase the expected life advantage.
Ownership view: define “lasts longer”
There are two “longer” questions:
1) Service life: how long until it no longer meets the load requirement.
2) Economic life: how long until replacement is the cheaper option.
LFP often wins on service life for daily cycling. Lead-acid can still win in low-cycle backup roles where upfront cost dominates.
Comparison table (practical, not salesy)
| Category | LiFePO4 (LFP) | Lead-Acid (AGM/Flooded/Gel) | What It Means for Solar |
|---|---|---|---|
| Typical cycling tolerance | High (often “thousands of cycles” marketed to ~80% SoH) | Lower (especially with deep daily cycling) | LFP usually fits daily self-consumption better |
| Sensitivity to partial recharge | Lower | Higher (sulfation risk) | Cloudy sites can punish lead-acid |
| Weight/space | Lower | Higher | Rack density and install labor change |
| Entretien | Low (mostly monitoring) | Higher for flooded (watering, equalize) | O&M burden differs |
| Protection electronics | Needs BMS | Simpler, but still needs proper charging | Wrong settings hurt both, differently |
Note: Specific cycle numbers vary widely by brand, DoD, and temperature. Treat any single number as a planning input, not a promise.
Signs a LiFePO4 Battery Is Near End-of-Life (Capacity Loss, Runtime Drop, BMS Cutoffs)
When customers send packs back, the earliest sign is rarely “won’t turn on.” It is usually shorter runtime and more shutdowns under the same load because resistance has crept up.
A LiFePO4 battery nearing end-of-life usually shows measurable capacity loss, reduced runtime under the same load, increased voltage sag, and more frequent BMS cutoffs during peaks. End-of-life is often defined around 80% of original capacity, but the pack may remain usable if the application can tolerate lower energy and power. The most reliable way to judge health is periodic capacity testing plus trend tracking of sag and cutoff events, not age alone.
1) Capacity loss: the cleanest indicator (if you measure it correctly)
Capacity checks do not need to be fancy, but they must be repeatable.
Simple field method (controlled discharge test):
- Start at a known SoC (ideally full, if safe and recommended).
- Discharge at a steady, moderate load (avoid extreme current).
- Record delivered kWh (or Ah) until a defined cutoff.
- Repeat every 6–12 months under similar temperature.
If delivered energy drops significantly compared to baseline, you have true capacity fade.
2) Runtime drop and voltage sag: what operators notice first
Two packs can show similar capacity at rest but behave differently under load.
- Rising internal resistance increases voltage sag.
- The inverter hits low-voltage thresholds earlier.
- You get less usable energy at real power levels.
Look for: same load, earlier cutoff, or more frequent inverter low-voltage alarms.
3) BMS cutoffs and “random” shutdowns: often power-related, not energy-related
Frequent BMS trips can mean:
- Load peaks exceed the pack’s safe current.
- Temperature rises and triggers protection.
- Cell imbalance causes one cell to hit limits early.
This is why a pack can show “fine SoC” but still shut down when a pump starts.
4) Cell imbalance: the hidden runtime thief
Imbalance can show up as:
- Early high-voltage cutoff near the top (one cell hits limit).
- Early low-voltage cutoff near the bottom (one cell sags first).
If balancing only happens near full, and you never charge near full, imbalance can grow quietly.
End-of-life does not mean “end of use”
A pack at ~80% SoH may still be perfectly fine for:
- Smaller loads
- Shorter backup windows
- Non-critical applications
But it may no longer fit:
- Peak shaving targets
- Long outage backup promises
- High surge loads
Diagnostic table: symptom → likely cause → action
| Symptom | Likely Cause | What To Check First | Typical Fix |
|---|---|---|---|
| Runtime shorter at same load | Capacity fade or higher resistance | Repeatable discharge test, kWh logs | Adjust expectations, add capacity, reduce load |
| More voltage sag under load | Rising internal resistance | Compare sag at same kW and temp | Reduce peak current, improve cooling, parallel packs |
| Frequent BMS cutoffs on peaks | Overcurrent or heat | BMS event logs, cable size, connector heat | Limit power, fix wiring, increase capacity |
| Early cutoff near full | Imbalance or charge settings | Cell delta at top, charger voltage | Occasional balance charge, verify charge profile |
| Early cutoff near empty | Imbalance or deep discharge | Cell delta at low SoC, inverter LVD | Raise low cutoff, avoid deep cycling |
FAQ
How many years will a LiFePO4 battery last in a solar system?
Many quality packs deliver roughly 8–15 years of dependable service in real solar use. Life depends on daily DoD, average temperature, and how hard you push current. Gentle cycling and cool operation can extend life beyond typical expectations.
Is 6000 cycles really equal to 10 years?
It can be, under the right conditions. If you average about 1 EFC per day, 6000 cycles is about 16.4 years on cycle count alone. Real systems lose some life to calendar aging, heat, and high current, so 10+ years is realistic when you keep stress low (for example ~0.2C and ~25°C).
What does “80% capacity” end-of-life mean?
It means the pack has about 80% of its original usable energy under the test conditions. It is not a sudden failure point. Many users keep running LFP batteries beyond that if the reduced runtime still meets the application needs.
Does charging to 100% every day hurt LiFePO4?
It can increase calendar aging if the pack sits at high SoC for long periods, especially in heat. A practical strategy is operating in a mid-SoC band most days and charging to 100% only occasionally for balancing, depending on how the BMS balances.
What’s the best DoD for long LiFePO4 life?
Shallower cycling typically yields more total cycles. Many systems target something like 20–80% or 25–75% for daily operation when capacity allows. You still need to meet backup requirements, so the “best” band is the one that protects life without breaking the project’s energy promise.
Do high C-rate loads really shorten lifespan?
Yes, often because high current increases heating and stress. Even if the pack is rated for the current, routinely pushing near limits can accelerate resistance growth and cause earlier BMS cutoffs. If you want long life, design so typical operation is comfortably below the continuous rating.
Why does my LiFePO4 battery shut off even when SoC looks high?
SoC can look fine while the BMS trips on overcurrent, low voltage under load, température, or cell imbalance. The fastest way to diagnose is to read BMS event logs and compare voltage sag under a known load.
How do I know if my battery is degrading: capacity or just settings?
Trend both: delivered kWh on a controlled discharge test (capacity) and voltage sag at the same kW load (resistance). If capacity is stable but sag worsens, you may have rising resistance, wiring losses, or power peaks that are too aggressive.
Can I use a lead-acid charger on LiFePO4?
Usually not safely as a default. LFP requires a LiFePO4-appropriate charging profile and protection logic. Always follow the battery vendor’s recommended voltage limits and confirm your inverter/charger has an LFP mode or configurable setpoints.
Conclusion
LiFePO4 lasts longest when it stays cool, avoids high C-rate stress, and cycles in a mid-SoC band. Set proper charge limits and track EFCs to protect ROI.